Column
Ref:column (content-hero)
Column
Ref:column (content-video)
Top image
[Insights by Boundless Learning™][width::350]
Top image mobile
[Insights by Boundless Learning™][width::200]
Title (hero title, title large, py 8)
Make confident decisions about your academic portfolio
Content
Insights by Boundless Learning™ brings learner demand, workforce trends, peer benchmarking, AI exposure, and financial modeling together to help institutions evaluate programs and make more informed portfolio decisions.
Button (primary)
Button Label
Book a Demo
Button (tertiary)
Column
Ref:column (content-copy)
Column
Ref:column (content-image)
Eyebrow
The Portfolio Opportunity
Title (title extra large, title underline)
What comes next for your academic portfolio?
Content
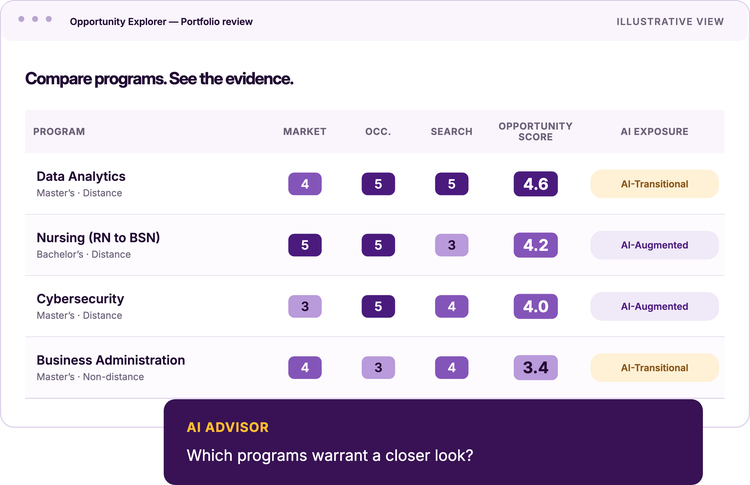
Use connected evidence to identify what deserves investment, attention, or further review. Evidence informs the decision. Institutional mission, readiness, economics, and judgment determine the path.
Image
Icon
[width::80px]
Content (title medium)
Strengthen existing programs
Protect and reinforce programs that support enrollment, revenue, reputation, and institutional priorities.
Icon
[width::80px]
Content (title medium)
Evaluate new opportunities
Compare potential additions with your current portfolio and investigate the evidence behind each opportunity.
Icon
[width::80px]
Content (title medium)
Reposition programs
Identify where changing market conditions, competitive pressures, or learner demand may create opportunities to reposition or strengthen existing programs.
Icon
[width::80px]
Content (title medium)
Assess candidates for sunsetting
Identify programs that may warrant deeper review for consolidation or closure, informed by market evidence and institutional priorities.
Column
Ref:column (content-1)
Eyebrow
THE DECISION STORY
Title (title extra large, title underline)
Explore the decision journey
Subtitle (title medium, title-semi-bold)
Build the portfolio you want to explore
Content
Compare opportunities, understand peer position, test assumptions, and ask questions of the evidence.
Tab
Program Discovery
Tab Content
program-discovery
Tab
Opportunity Explorer
Tab Content
opportunity-explorer
Tab
Market Position
Tab Content
market-position
Tab
Business Case
Tab Content
business-case
Tab
AI Advisor
Tab Content
ai-advisor
Content (mobile full bleed)
Title (title small)
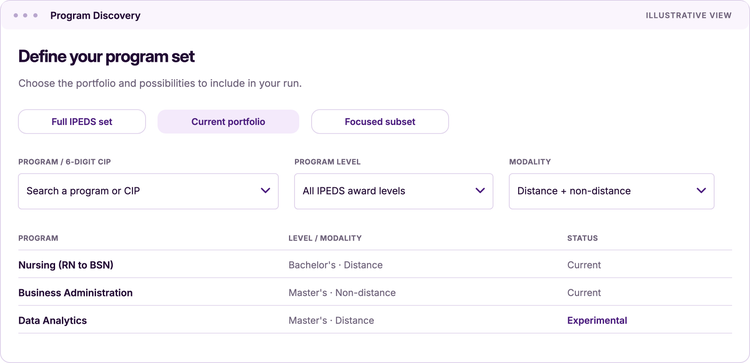
Program Discovery: Build the portfolio you want to explore
Content
Start with your institution's existing programs, explore the broader academic program landscape, or build a focused comparison set. Select programs by field of study, degree level, and delivery modality, and add proposed offerings to evaluate potential opportunities alongside your current portfolio. Save your selections for further analysis.
Content (mobile full bleed)
Title (title small)
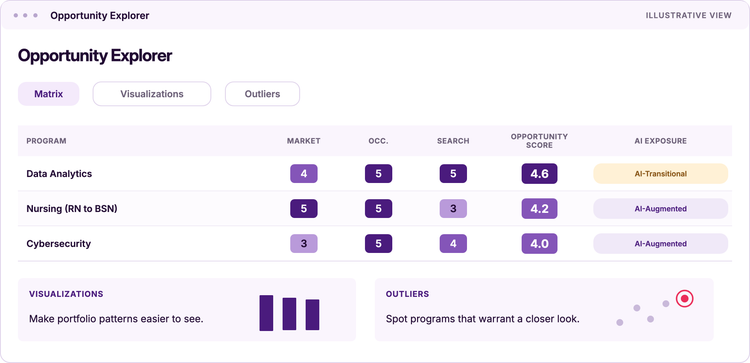
Opportunity Explorer: See where opportunity stands out
Content
Interactive visualizations help users interpret program scores, identify outliers, and explore the evidence behind potential opportunities.
Content (mobile full bleed)
Title (title small)
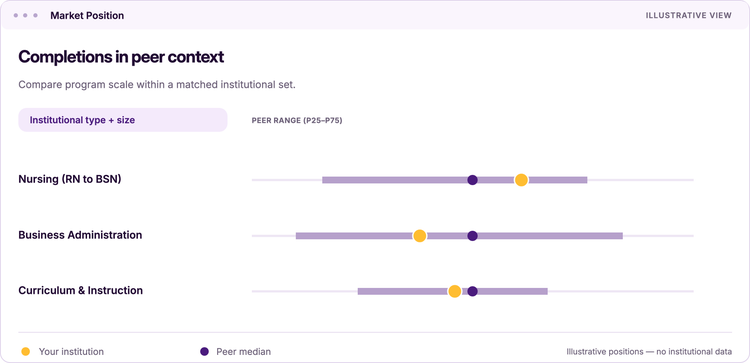
Market Position: Benchmark your programs against peers
Content
Compare program completions and market position against relevant peer institutions. Identify areas of relative strength, competitive concentration, and opportunities for differentiation or further investigation.
Content (mobile full bleed)
Title (title small)
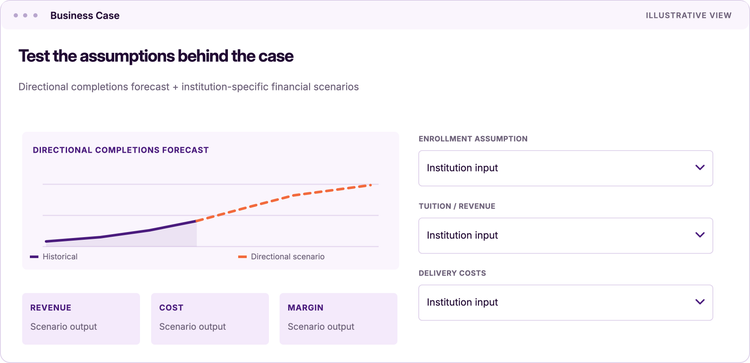
Business Case: Build and test directional scenarios
Content
Test the assumptions behind your next move. Explore directional completions forecasts and editable financial scenarios to evaluate possible investments, compare options, and understand what would need to be true for a program to succeed.
Content (mobile full bleed)
Title (title small)
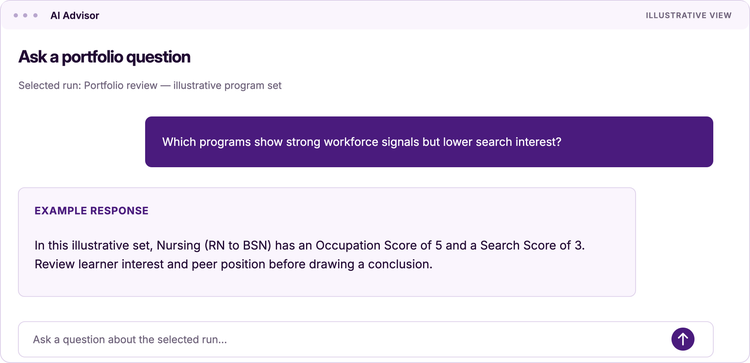
AI Advisor: Use natural language to explore the data
Content
Ask questions in plain language and explore what the evidence suggests. AI Advisor helps you investigate patterns, interpret each run, compare programs, and surface next questions — while keeping the underlying data and institutional judgment at the center of the process.
Column
Ref:column (content-1)
Eyebrow
From evidence to decision
Title (title extra large, title underline)
Every program has a decision story
Content
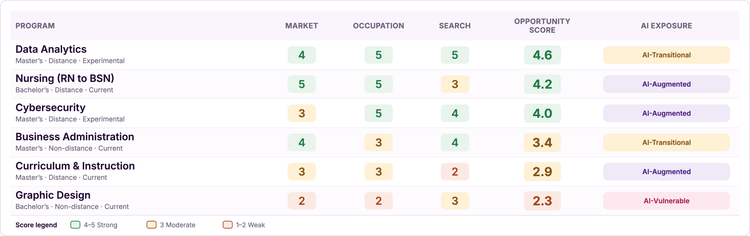
Compare relative program opportunity scores alongside academic market supply, workforce opportunities, and learner search interest. See where the evidence aligns or conflicts, identify programs worth investigating, and consider AI exposure as an additional lens on occupational change.
Column
Ref:column (content image)
Image
Eyebrow
Data Inputs
Title (title extra large)
Multiple data sources. One connected view of opportunity.
Description
Insights by Boundless Learning™ brings together academic market data, workforce intelligence, learner search interest, and competitive benchmarks to reveal program opportunities, highlight trade-offs, and support more informed portfolio decisions.
Item
IPEDS
Tab Label
IPEDS
Category
Academic Market
Source
Integrated Postsecondary Education Data System administered by the National Center for Education Statistics
Summary
CIP code and award level • Online/on-campus context • Historical growth • Competitor counts
Content
IPEDS provides national program completions, institutional characteristics, degree-level information, and distance education availability. These data help institutions understand competitive supply, historical trends, and relative market position.
Item
Lightcast ™
Tab Label
Labor market intelligence
Category
Workforce
Source
Labor market analytics
Summary
Job postings • Annual openings • Projected occupational growth • Employment and salary indicators
Content
Lightcast ™ provides labor-market intelligence, including job postings, occupational demand, employment trends, and earnings. These indicators help connect academic programs to workforce opportunities and changing employer needs.
Item
BLS
Tab Label
BLS
Category
Workforce
Source
U.S. Bureau of Labor Statistics
Summary
Long-term occupational projections • National employment benchmarks • Public-sector context
Content
Official 10-year job growth projections and national employment baselines straight from the federal government. It's the independent gut check on the privately sourced market data.
Item
SEMRUSH
Tab Label
SEMRUSH
Category
Learner Interest
Source
Search and keyword intelligence
Summary
Geographic and global monthly search volume • Program-specific keyword clusters • Relevant search terms for scoring
Content
Monthly U.S. and global search volume, related keywords, and top search terms for each program. It shows what prospective students are actually looking for, before they've talked to an advisor.
Quote
Academic portfolio decisions are rarely simple because the evidence behind them is fragmented across data sources, market signals, and institutional considerations. The value of Insights by Boundless Learning is seeing those signals side by side, understanding where they converge or conflict, and combining that evidence with institutional expertise to determine what to do next.”
Cite
— Andrea M., Senior Director of Research and Insights
Column
Ref:column (content-copy)
Column
Ref:column (content-accordion)
Eyebrow
TRUST & METHODOLOGY
Title (title extra large, title underline)
Transparent enough to trust
Content
Scores, forecasts, and AI-assisted analysis are inputs to a decision — not a verdict. We make the evidence, assumptions, and limitations visible so you can decide what they mean for your institution.
WANT TO GO DEEPER?
WANT TO GO DEEPER?
Button (primary)
Button label
Talk with an expert
Button (secondary)
Button label
explore more FAQs
Summary
Does the Opportunity Score tell me what to do?
Main Content
No. The Opportunity Score is a versioned, relative comparison within the programs included in a run — not a probability of success or an automatic recommendation. It helps surface programs for closer review; institutional priorities, capabilities, economics, and judgment still determine the path forward.
Summary
Can I evaluate programs we don’t currently offer?
Main Content
Yes. Insights by Boundless Learning™ can include both current and experimental programs within the same run. Explore potential program areas, degree levels, and delivery modalities alongside your existing portfolio to see how new possibilities compare.
Summary
Are the forecasts enrollment predictions?
Main Content
The forecasts are directional completions scenarios designed to support planning — not promises of institutional enrollment. They provide a starting point for the Business Case, where enrollment and financial assumptions can be adjusted to reflect your institution’s circumstances.
Summary
How is the AI Advisor grounded in the evidence?
Main Content
The AI Advisor works within the context of the selected data run, helping users investigate patterns, compare programs, and interpret the available evidence. The underlying data remains visible, and important conclusions should be validated against the evidence and institutional context.
Summary
Where does the data come from, and how current is it?
Main Content
Insights by Boundless Learning™ integrates federal higher education data from IPEDS, workforce intelligence from Lightcast ™ and the U.S. Bureau of Labor Statistics, and learner search signals from Semrush. Data refresh schedules vary by source, and some datasets, particularly federal education and employment statistics, have reporting lags. Insights identifies the source and reporting context to help users interpret the evidence appropriately.
Summary
How are peer institutions selected?
Main Content
Peer comparisons are designed to provide relevant institutional context rather than simply comparing every institution in the market. Insights by Boundless Learning™ uses factors including Carnegie classification and institutional size to establish an appropriate comparison set for program-level benchmarking.
Summary
What does an AI exposure flag mean?
Main Content
AI exposure reflects how emerging AI capabilities may affect the tasks associated with occupations connected to a program. It is an additional workforce and curriculum lens—not a prediction that an occupation will disappear or that a program should be launched, changed, or discontinued.
Summary
How is the Opportunity Score calculated?
Main Content
The Opportunity Score combines standardized indicators of academic market conditions, workforce opportunity, and learner search interest to help compare programs within a defined analysis. The score provides a relative measure of opportunity rather than an absolute prediction of success. Individual component scores help users understand the factors contributing to each program's position.
Content
{xf::fragments/contact-us-insights}
ID
contact-us
Column
Ref:column (content-copy)
Column
Ref:column (content-image)
Eyebrow
Insights by Boundless LearningTM
Title (title extra large, title underline)
Ready to make your next portfolio decision?
Content
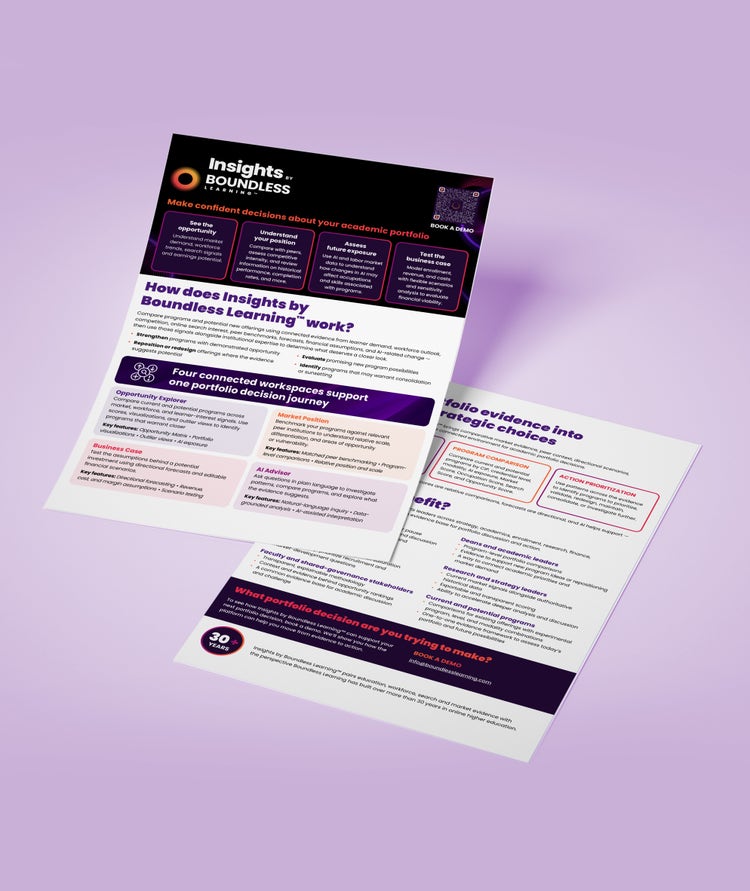
Bring us the portfolio decision you’re working through. We’ll show you how Insights by Boundless LearningTM can help you compare the evidence, evaluate your options, and determine what to explore next.
Button (primary)
Button Label
Book a demo
Button (secondary)
Button label
Download brochure
Image
Content
{xf::fragments/booking-modal}
ID
booking-modal-id