- Can you share your professional background and what led you to pursue a role in business analytics at Boundless Learning?
- What are your primary responsibilities as the Manager of Business Analytics, and how do you contribute to the organization’s overall success?
- How do you develop and implement data strategies that align with Boundless Learning’s goals and mission?
- Can you provide an example of how your team’s analytics work has driven a significant decision or change within the organization?
- What tools, platforms, or technologies do you rely on most for data analysis?
- How do you work with other departments to ensure data insights are effectively communicated and actionable?
- What are the biggest challenges you face in managing and analyzing data, and how do you overcome them?
- How do you see data analytics shaping the future of EdTech, and what role does Boundless Learning play in that transformation?
- How do you foster growth and innovation within your analytics team to stay ahead of industry trends?
- What are your long-term goals for the business analytics function at Boundless Learning, and how do you plan to achieve them?
‘It’s Always an Adventure’: Discussing Data, Analytics, and Collaboration with Joy David

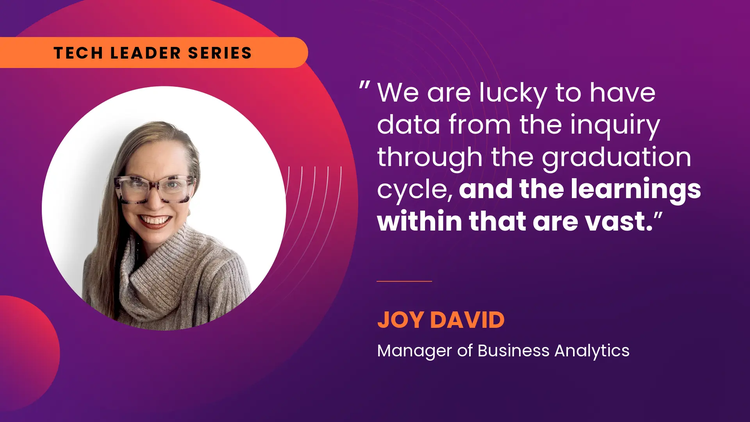
Meet Joy David, Manager of Business Analytics for Boundless Learning. In a role that allows her to make full use of her background in statistics, she uses data, collaboration, and a passion for problem-solving to drive impact across the organization.
Throughout her 30-year career, which includes 17 years with Boundless Learning, Joy has helped integrate new technologies and improve our usage and implementation of existing platforms. Today, she works cross-functionally to help us make data-informed decisions and provide better support to empower learners across the globe.
“It’s always an adventure,” she says.
See how a love of math and a fascination with analytics have inspired her three-decade journey and helped her impact countless lives with Boundless Learning.
Key takeaways:
- Joy’s role bridges business needs with analytics, building reports and enabling data-driven decisions.
- Strategies are developed by understanding how stakeholders use data for decision-making.
- Dashboards have quantified intervention impact and reduced student melt.
- Key tools include BigQuery, Dataplex, and Tableau, with strong focus on data quality.
- The Partner Dashboard gives shared visibility to inform joint strategy with institutions.
- Long-term goals include integrating AI into everyday analytics workflows for better insights.